Analytics - Users/Groups Tab
Track engagement across users and groups in your knowledge base
Table of Contents
What is the Users/Groups Tab Why are the Users/Groups Analytics Important? How to Access This Section Tables in This Section Checking the Activity of Each User/Group How to Filter the Data Example: How to Interpret the Data How to Export the Data Data Dictionary Best PracticesThe Users & Groups Tab in Helpjuice Analytics helps you understand how individual users and user groups interact with your knowledge base. By reviewing these insights, you can identify which groups are most active, what content they access, and where there may be gaps in usage.
In this article, you’ll learn:
- How to access the Users & Groups Tab
- What each metric means
- How to interpret data at the user and group level
- Best practices for analyzing engagement
What is the Users/Groups Tab
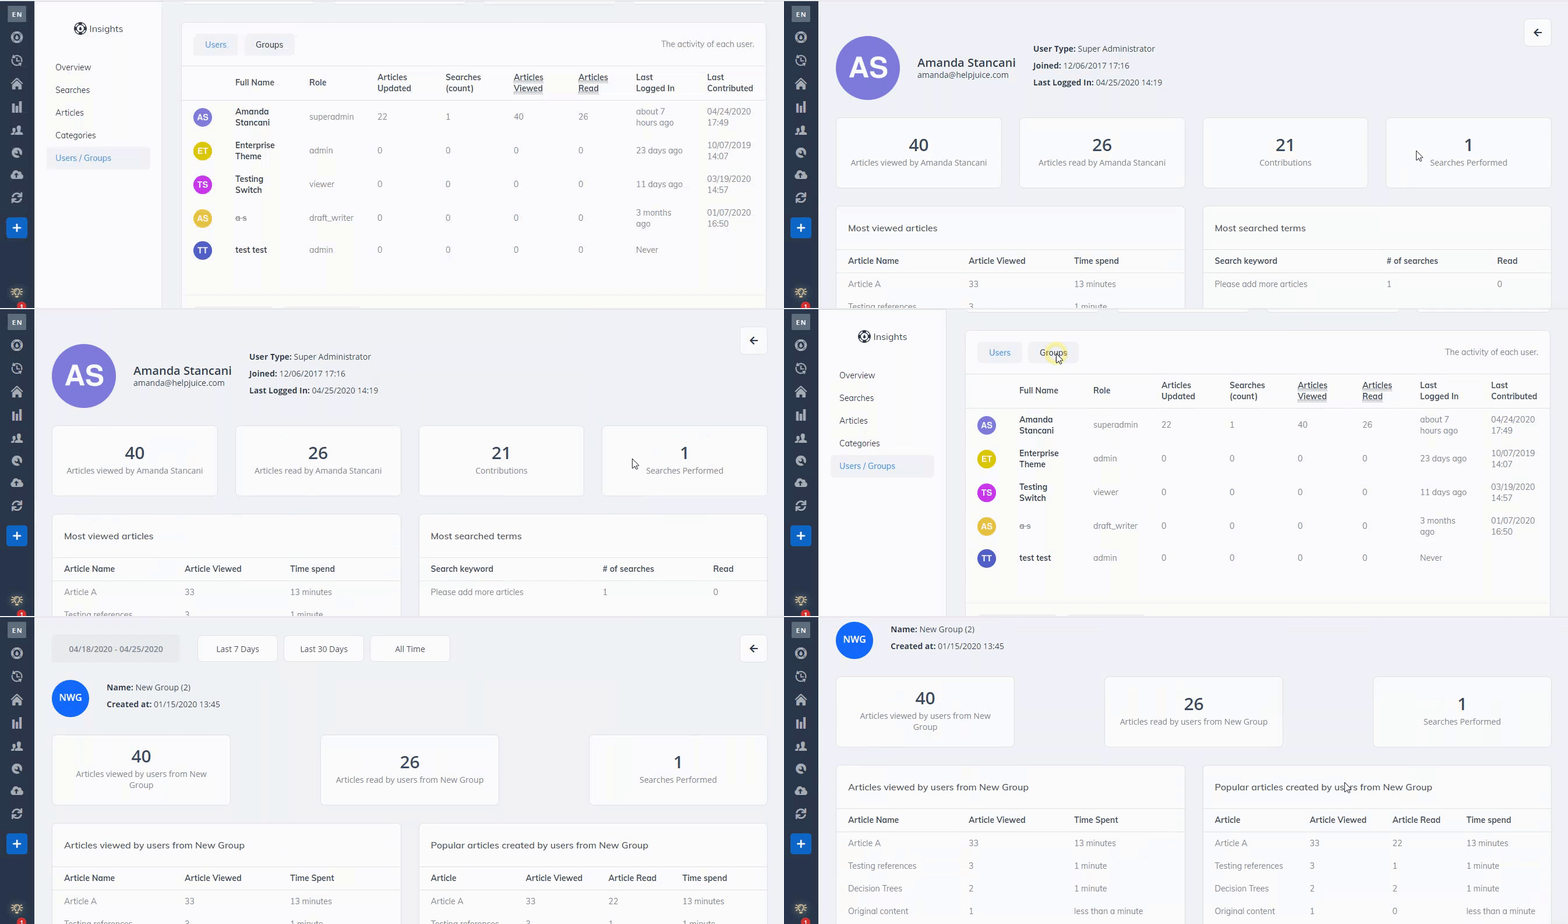
The Users/Groups tab in the analytics section provides valuable insights into the activity levels of individual users and groups within your Knowledge Base. This feature allows you to track user engagement and assess how different groups are interacting with your content, helping you understand usage patterns and identify areas for improvement.
Why are the Users/Groups Analytics Important?
Monitoring user and group activity is crucial for several reasons:
- Engagement Insights: Understanding who is using your Knowledge Base and how they interact with the content can help tailor resources to meet user needs effectively.
- Performance Tracking: By analyzing activity data, you can evaluate the effectiveness of your Knowledge Base and make informed decisions on content updates or enhancements.
- Identifying Trends: Recognizing patterns in user behavior can reveal trends that may inform your future content strategy or training needs.
How to Access This Section
Accessing the Users/Groups tab is straightforward. Follow these steps:
- Open your Dashboard.
- Click on the Analytics icon.
- In the Analytics page, navigate to the Users/Groups tab.

Tables in This Section
Users Table
The Users table provides a detailed view of individual user activity with the following columns:
- Full Name: The name of the user.
- Role: The user’s role within the Knowledge Base.
- Articles Updated: The number of articles the user has updated.
- Searches (count): The total number of searches conducted by the user.
- Articles Viewed: The total number of articles viewed by the user.
- Articles Read: The number of articles the user has read (spent at least 10 seconds on the page).
- Last Logged In: The last time the user accessed the system.
- Last Contributed: The date of the user’s most recent contribution.

Groups Table
The Groups table summarizes group activity with the following columns:
- Group Name: The name of the group.
- Articles Updated: The number of articles updated by the group.
- Searches: The total number of searches conducted by the group.
- Articles Viewed: The total number of articles viewed by the group.
- Articles Read: The number of articles read by the group.

Checking the Activity of Each User/Group
To delve deeper into user or group activities, simply click on the respective User name or Group. This action will display a complete list of their activities, providing you with detailed insights into their engagement with your Knowledge Base.
How to Filter the Data
The Articles tab allows you to filter the analytics data by:
- Timeframe: Use the calendar to set a specific date range or choose from options like Last 7 Days, Last 30 Days, or All Time.
- Accessibility: Filter searches by Public Only, Internal Only, or Both Public & Internal.

Example: How to Interpret the Data
Let’s say you’re reviewing the Sales Team Group:
- # of Sessions: 120
- # of Searches: 200
- Found Answer: 150
- Bounced: 30
Interpretation:
- The sales team is highly engaged, with frequent searches.
- Most searches (150/200) result in answers, showing content is helpful.
- 30 bounces suggest some articles could be improved to reduce friction.
How to Export the Data
You can export the analytics data for articles in .XLS or .CSV format for further analysis. To do so, simply scroll to the bottom of the page and click on Export XLS or Export CSV, and the file will be automatically downloaded to your computer.

Data Dictionary
Users File
The Users File includes the following fields:
| Column | Description |
|---|---|
| Name | The full name of the user |
| The user's email address | |
| Articles Updated | The number of articles the user has updated |
| Articles Viewed | The total number of articles viewed by the user |
| Articles Read | The number of articles the user has read. |
| Current Sign In At | The timestamp of the user's current sign-in |
| Last Contributed | The date of the user’s most recent contribution |
Groups File
The Groups File includes the following fields:
| Column | Description |
|---|---|
| Name | The full name of the group |
| Articles Updated | The number of articles updated by the group |
| Searches | The total number of searches conducted by the group |
| Articles Viewed | The total number of articles viewed by the group |
| Articles Read | The number of articles read by the group |
Best Practices
- Compare groups regularly to see which teams are most active.
- Identify users or groups with low activity – this may indicate a lack of awareness or content relevance.
- Use bounce rates as a signal that content needs refinement.
- Encourage active groups (like sales or support teams) to share insights with less active ones.
